Digital Waste Management with Dashboard – Using Data for Better Decisions
Why Waste Data Matters
In today's digital era, decision-making is increasingly data-driven including in facility management and waste emptying. Until recently, corporate waste management was a black box: How much waste is generated? Are bins emptied too early or too late? Without data, facility managers had to rely on estimates and occasional checks. Digital dashboards change this paradigm.
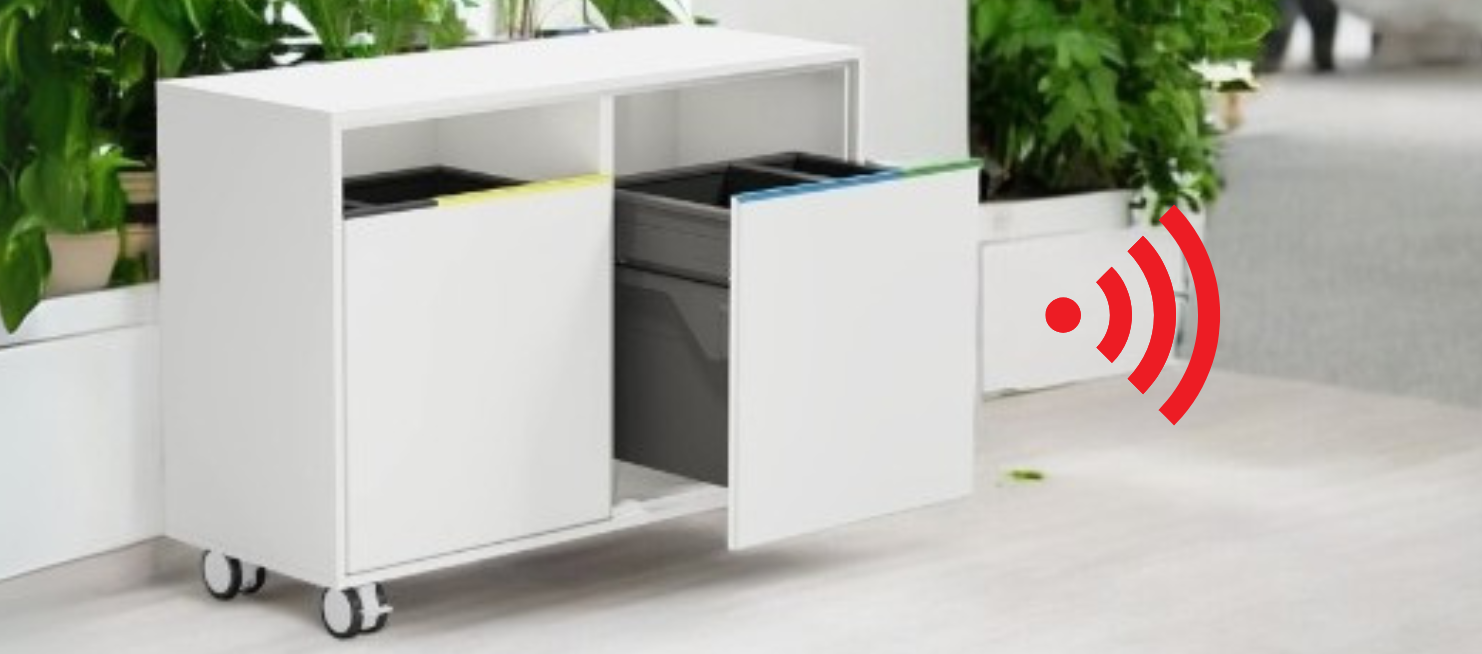
Thanks to IoT sensors (see Article: Fill-LevelSensors for Waste Bins), waste data is continuously collected and centralized. This data foundation is essential for optimizing processes, identifying high-waste areas, tracking peak times, and measuring the impact of initiatives (e.g., new bin placements).
- Real-Time Fill-Level Monitoring:
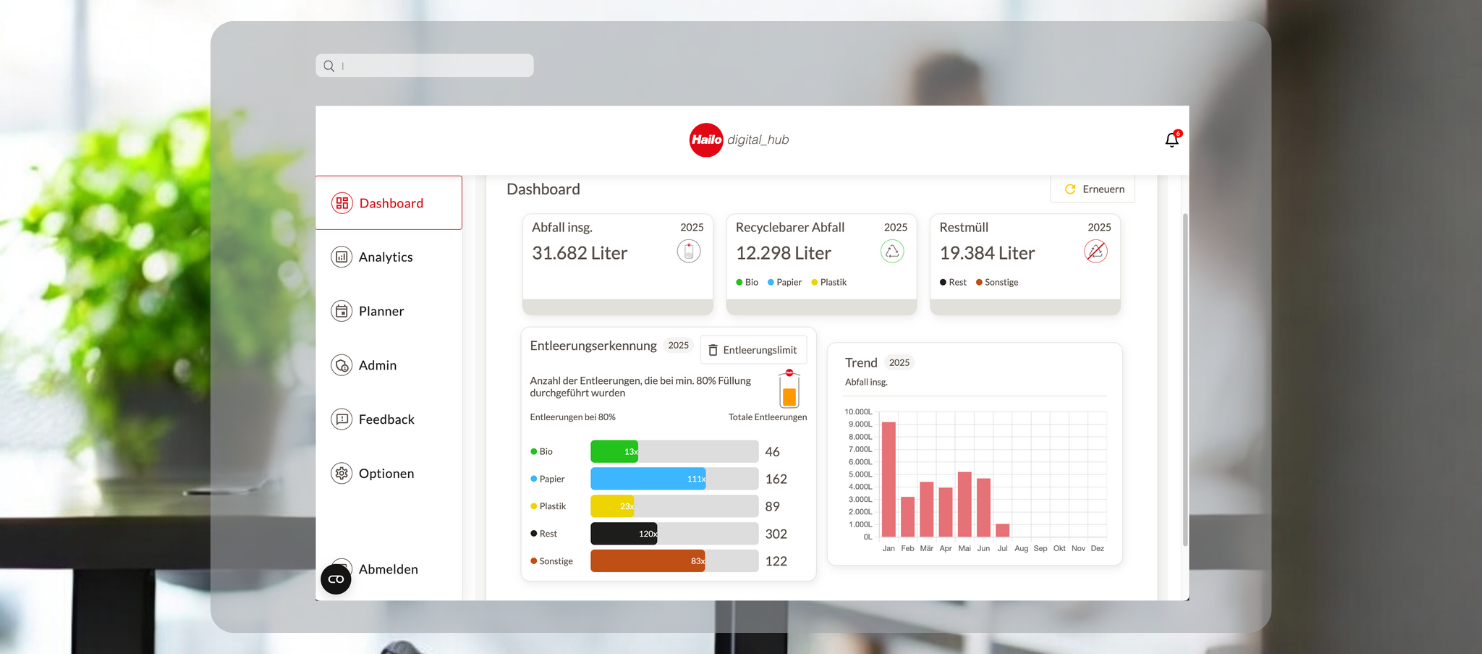
The dashboard displays current fill levels for each connected bin, updated live or at frequent intervals. Visual indicators (e.g., color codes or fill bars) highlight bins needing attention across all locations—from individual office bins to outdoor containers. Alerts notify staff proactively, preventing overflows. - Historical Data Analysis and Trends:
Beyond real-time insights, dashboards offer extensive analytics to track waste patterns: day-of-week or seasonal trends, changes in waste composition, and more. Historical comparisons across sites identify best practices—valuable for enterprise-wide optimization. - KPIs and Efficiency Reports:
Dashboards present performance metrics such as average fill percentage at collection, collections per week, and cleaning hours saved. Such KPIs demonstrate efficiency gains—for instance, raising the average fill rate from 60% to 85% before collection reduces unnecessary emptying. - ESG and Sustainability Reporting:
Modern companies increasingly report on Environmental, Social, and Governance (ESG) factors. The Smart Waste Dashboard provides robust data to support sustainability reports, such as total waste volumes, recycling rates, and CO₂ reductions from optimized routes. Hailo digital_hub offers real-time, ESG-ready reporting tools, helping organizations document their environmental progress credibly. - Integration and User-Friendliness:
Cloud-based dashboards require minimal local setup and are accessible via web browser or mobile app. Facility managers can instantly view all relevant data from the office or on the go. Interfaces are intuitive, with alerts and filters ensuring ease of use.
APIs enable seamless integration with other facility management systems, ensuring Smart Waste Dashboards fit effortlessly into a company’s digital ecosystem.
Conclusion
A digital dashboard transforms waste data into actionable decisions. For facility managers and cleaning service providers, Hailo digital_hub’s Smart Waste Dashboard is a powerful tool for transparency and efficiency from daily planning to annual ESG reporting. It’s no surprise this digital approach is becoming the industry standard.
Would you like to optimize your waste management with data-driven insights? Discover our Smart Waste Dashboard and experience its advantages in a personalized demo. Contact us today we’ll show you how to leverage your waste data effectively!