
Support Hub.
Get practical support for our Smart Waste Solutions – from the initial setup to daily use. Clearly explained, well structured, and available at any time.
You’re in good hands with us.
From initial contact to delivery and a ready-to-use solution, we provide personal support and ensure a smooth and efficient process.
Our commitment: maximum transparency, easy handling, and complete satisfaction.
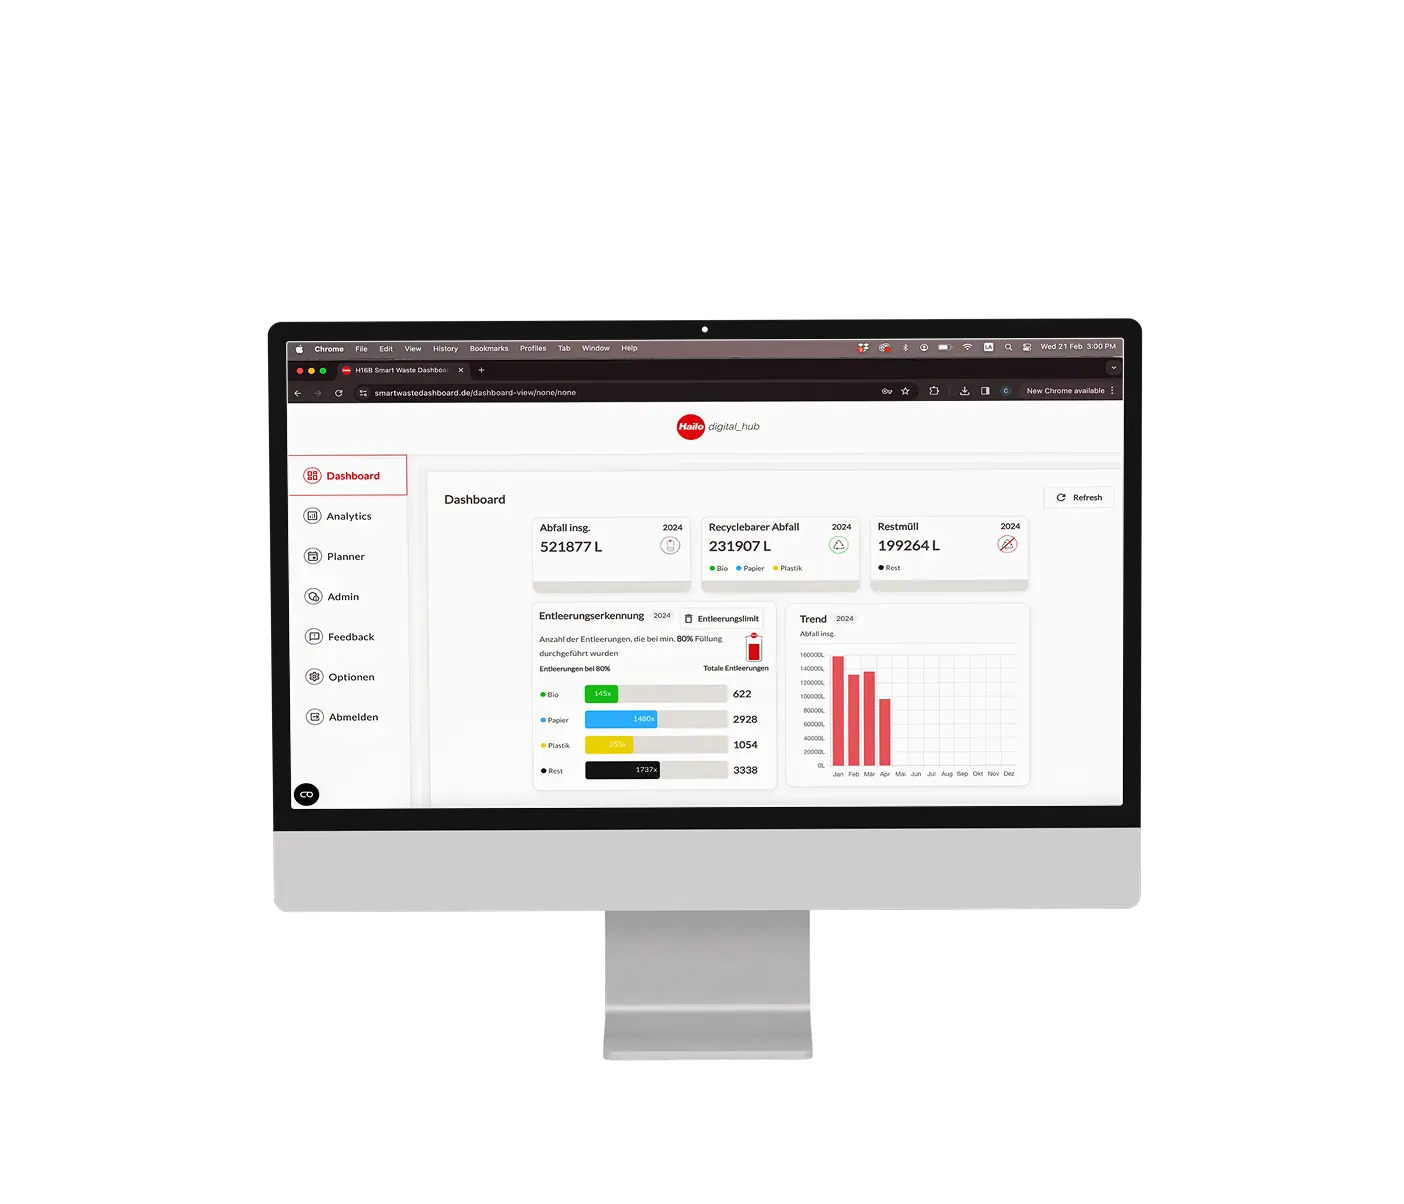
Smart Waste Dashboard.
The Smart Waste Dashboard provides real-time fill levels, emptying data, and analytics – the foundation for efficient and sustainable decisions.
Our video tutorials guide you through key features and show how to evaluate information efficiently
Introduction to the Planner Module
Data analysis with the Analytics Module
Create a new Facility
Set Up and Manage Tenant
Sensors – for Retrofit & Smart Waste Stations.
Whether used as a retrofit solution in existing containers or integrated into the Smart Waste Station, our sensors provide transparent fill level data for demand-based emptying.
In our video tutorials, we guide you step by step through sensor installation, sensor replacement, and troubleshooting.
Installation of the Smart Waste Sensors
FAQ.
Smart Waste Dashboard.
User accounts are created by our Customer Success Team and send automatically via email.
You can invite additional users at any time if required.
In the Analytics section, you can filter data by buildings, areas, or time periods. Using the Export as PDF function, you can then generate the desired report with a single click.
In the Admin section, you can manage notifications per user, enabling or disabling them individually. This ensures that alerts are distributed strictly according to roles.
Yes, the Smart Waste solution is fully GDPR-compliant. All data is processed and stored exclusively within the EU in accordance with applicable data protection regulations.
Yes, it is possible to integrate sensor data into existing management or ERP systems. The connection is made via the Facility Data Standard (FDS) and enables structured further data processing.
In the Feedback section, you can share your ideas and input with us directly. Your feedback and product ideas enable us to implement focused improvements where they create the greatest value for you.
Smart Waste Sensor.
The sensor is equipped with an integrated lithium thionyl chloride battery and does not require an external power supply. It is designed for long-term operation of at least five years.
Yes, the sensor can be used outdoors. It is IP55-rated, meaning it is protected against dust ingress and water spray. It operates reliably in temperatures ranging from –20 °C to +70 °C and is designed for continuous operation.
The sensor measures fill levels using wireless time-of-flight laser technology. Measurement data is transmitted energy-efficiently via LoRaWAN and is centrally available in the Smart Waste Dashboard.
First, verify that the gateways are connected correctly and the status LED is green. If the gateway is active and the sensor still does not transmit any data, please contact our Customer Success Team.
Wir sind für Sie da.
Our support team assists you with all questions regarding setup, operation, and maintenance. Together, we make sure your Smart Waste Solution works exactly the way you need it to.
