Industry
Don't let full containers slow down your production.
Manage emptying based on demand instead of fixed intervals. Prevent overflows, reduce unnecessary tracks, and keep your operations running.


Full containers quickly turn into production bottlenecks.
Overflowing bins, blocked workflows, and unnecessary manual checks slow everything down - all because there's no clear visibility into container status.

Downtime
Overfilled containers block workflows. Material builds up, and processes are slowed down or interrupted.

Staff effort
Employees manually check containers or report issues. This consumes time without contributing to value creation.

Waste of resources
Containers are emptied as a precaution even when they are not full. This leads to unnecessary collections and avoidable costs.
If you can measure it, you can master it.
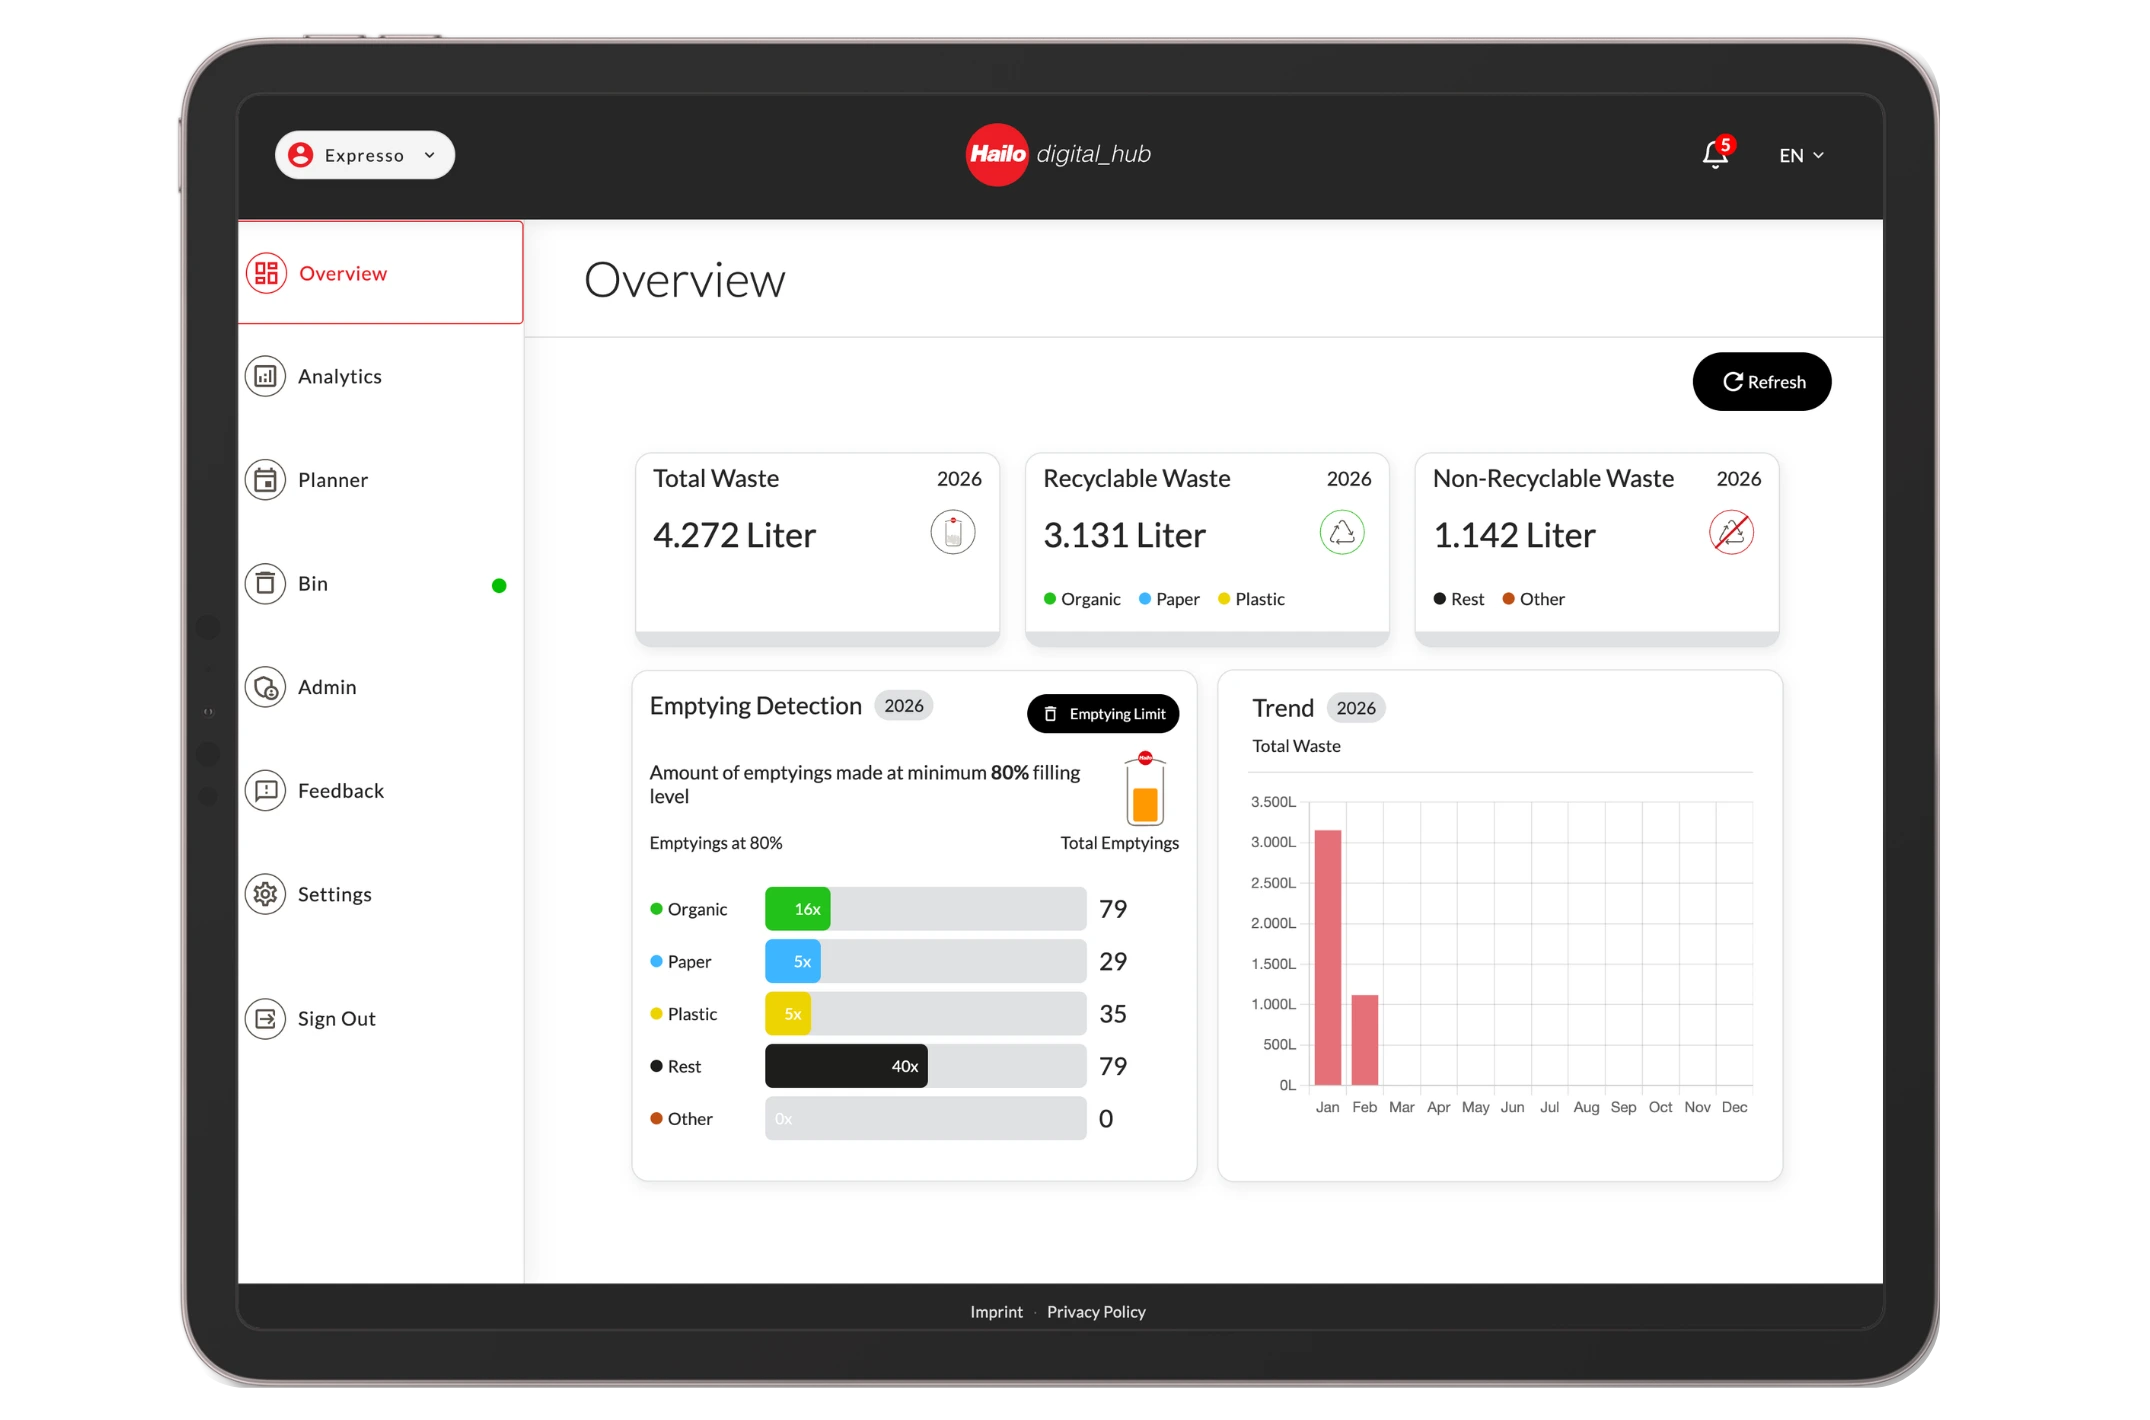
Sensors track fill levels directly along your production line. You can see in real time which containers are critical and trigger emptying as needed - instead of relying on fixed cycles or manual calls.
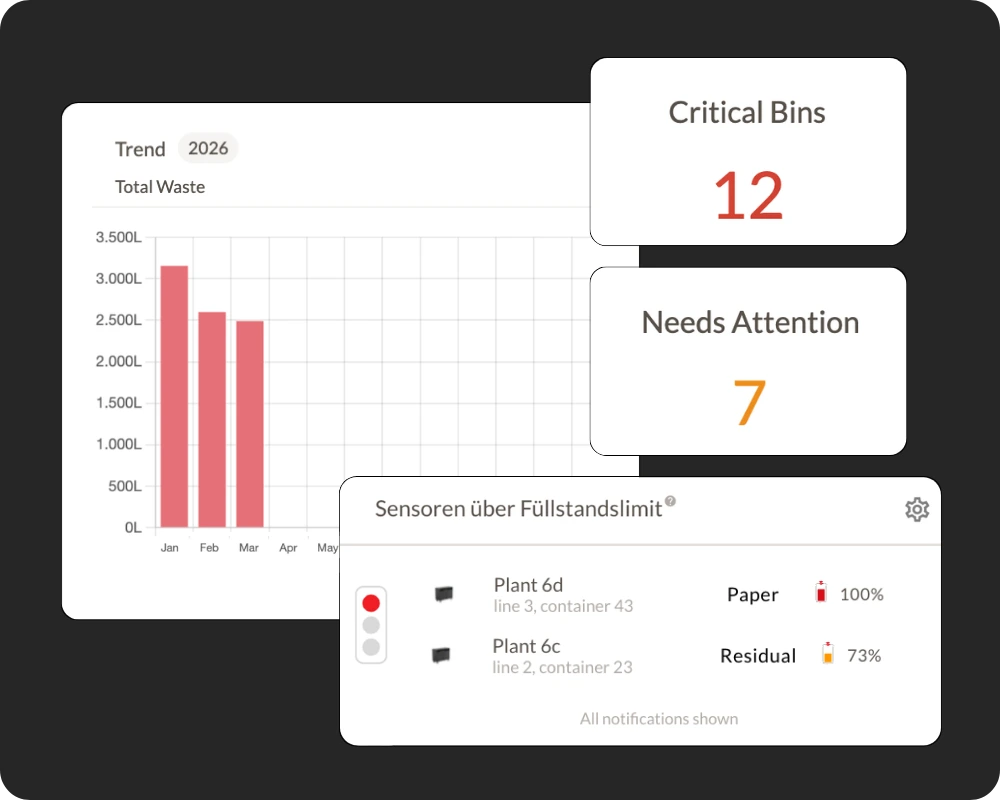

Real-time fill levels

Alert notifications

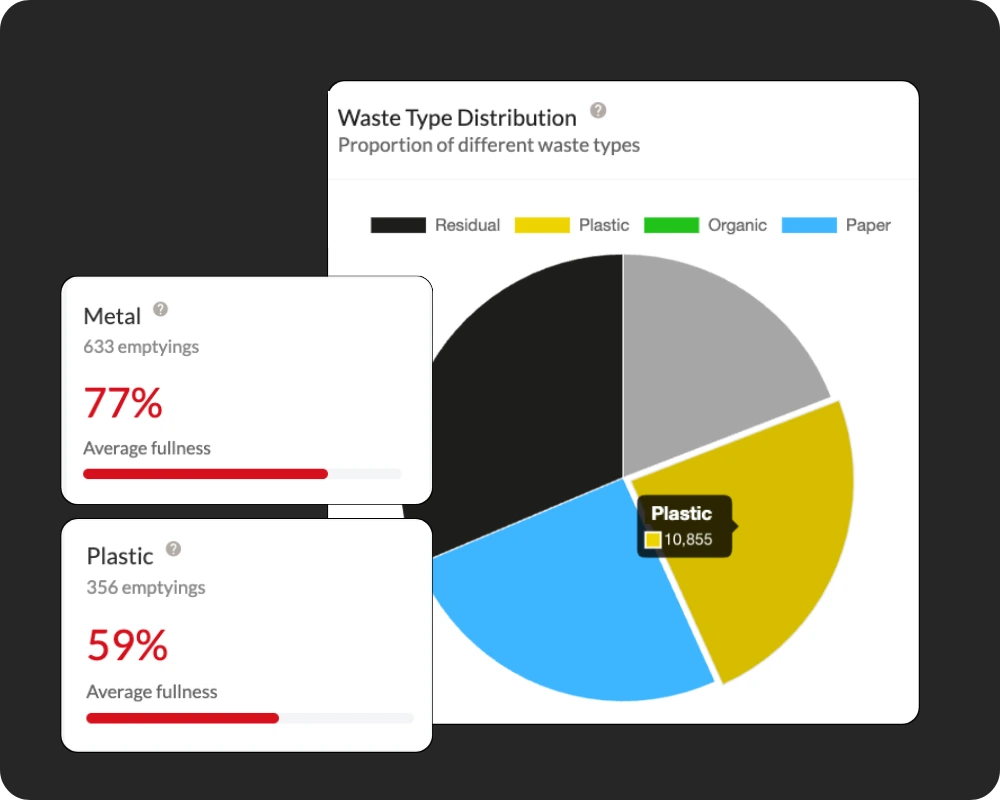
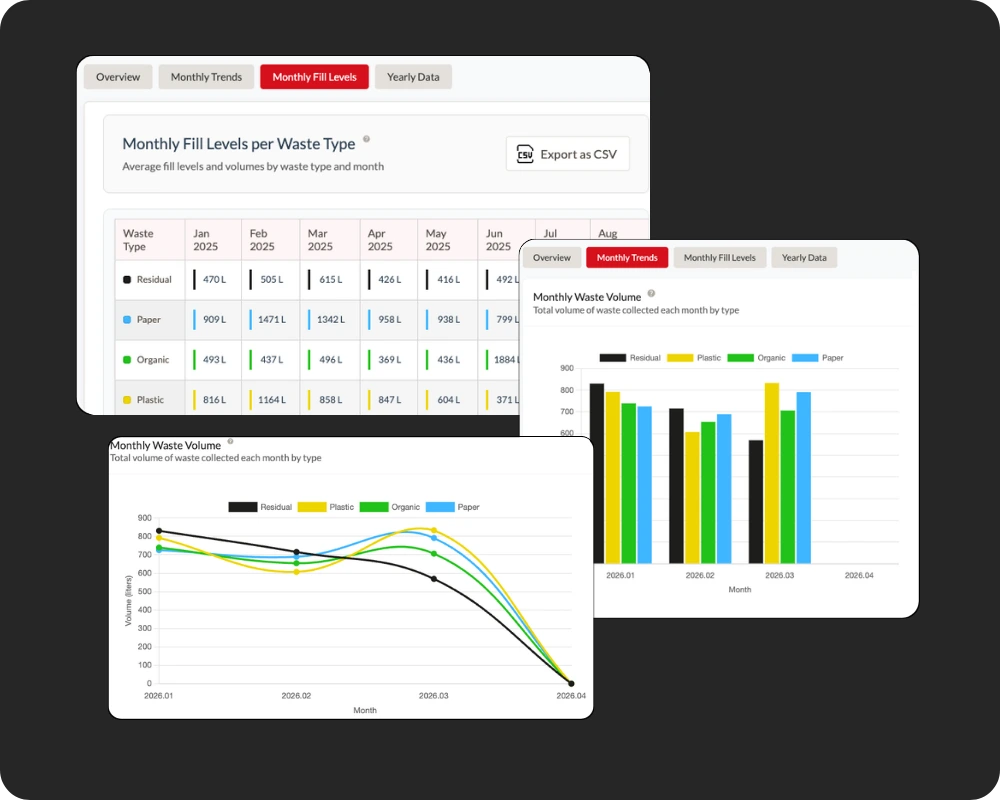
Full transparency of waste data
Seamlessly integrated into your production processes.
Used across production lines, assembly and packaging areas, as well as internal collection and recycling stations - without disrupting ongoing operations.
Waste data for reporting and process management.
You can see where effort is required and manage processes more effectively. At the same time, you build a reliable data foundation for reporting and ESG requirements.
Measurable savings in daily operations.
- Prevention of production disruptions
(approx. 1 per month at €5,000 → €60,000 per year) - Reduced emptying schedules
(1 fewer schedule per shift → approx. €16,500 per year) - Elimination of manual checks
(approx. €6,000 per year)
ANNUAL SAVINGS POTENTIAL
82,770 €
through avoided disruptions, fewer collections, and reduced manual effort
AMORTIZATION
approx. 4 months
ROI ~3x
*A sample site with 120 containers highlights the potential of optimizing a manually managed waste process.

The foundation for transparent emptying.
The Smart Waste Sensor captures fill levels directly at your containers and provides the data needed to manage your collection processes.
Combined with the Smart Waste Dashboard, it creates a consistent solution for daily operations.
Jointly developed.
For measurable waste processes.
For measurable waste processes.
With Watch N' Collect, Hailo digital_hub and Bica show how waste management can be understood as an integrated system: connected, data-driven and tailored to specific operating environments.
The joint solution complements our smart waste portfolio and connects sensors, dashboard and selected waste solutions in a partner project.

Are overfilled containers
impacting your operations?
In a short consultation, we assess your current setup and show you exactly where inefficiencies arise
— and how much you could save.
Meet our team.